Rates and bonds, the Treasury yield curve and the Fed funds rate
Interest rates sit under almost everything: mortgage rates, savings rates, the price of stocks and the cost of government borrowing. The Rates and bonds page shows the U.S. government's borrowing rates and the Federal Reserve's own rate, and how they have changed.
#The yield curve
Open Rates in the Finance section bar.
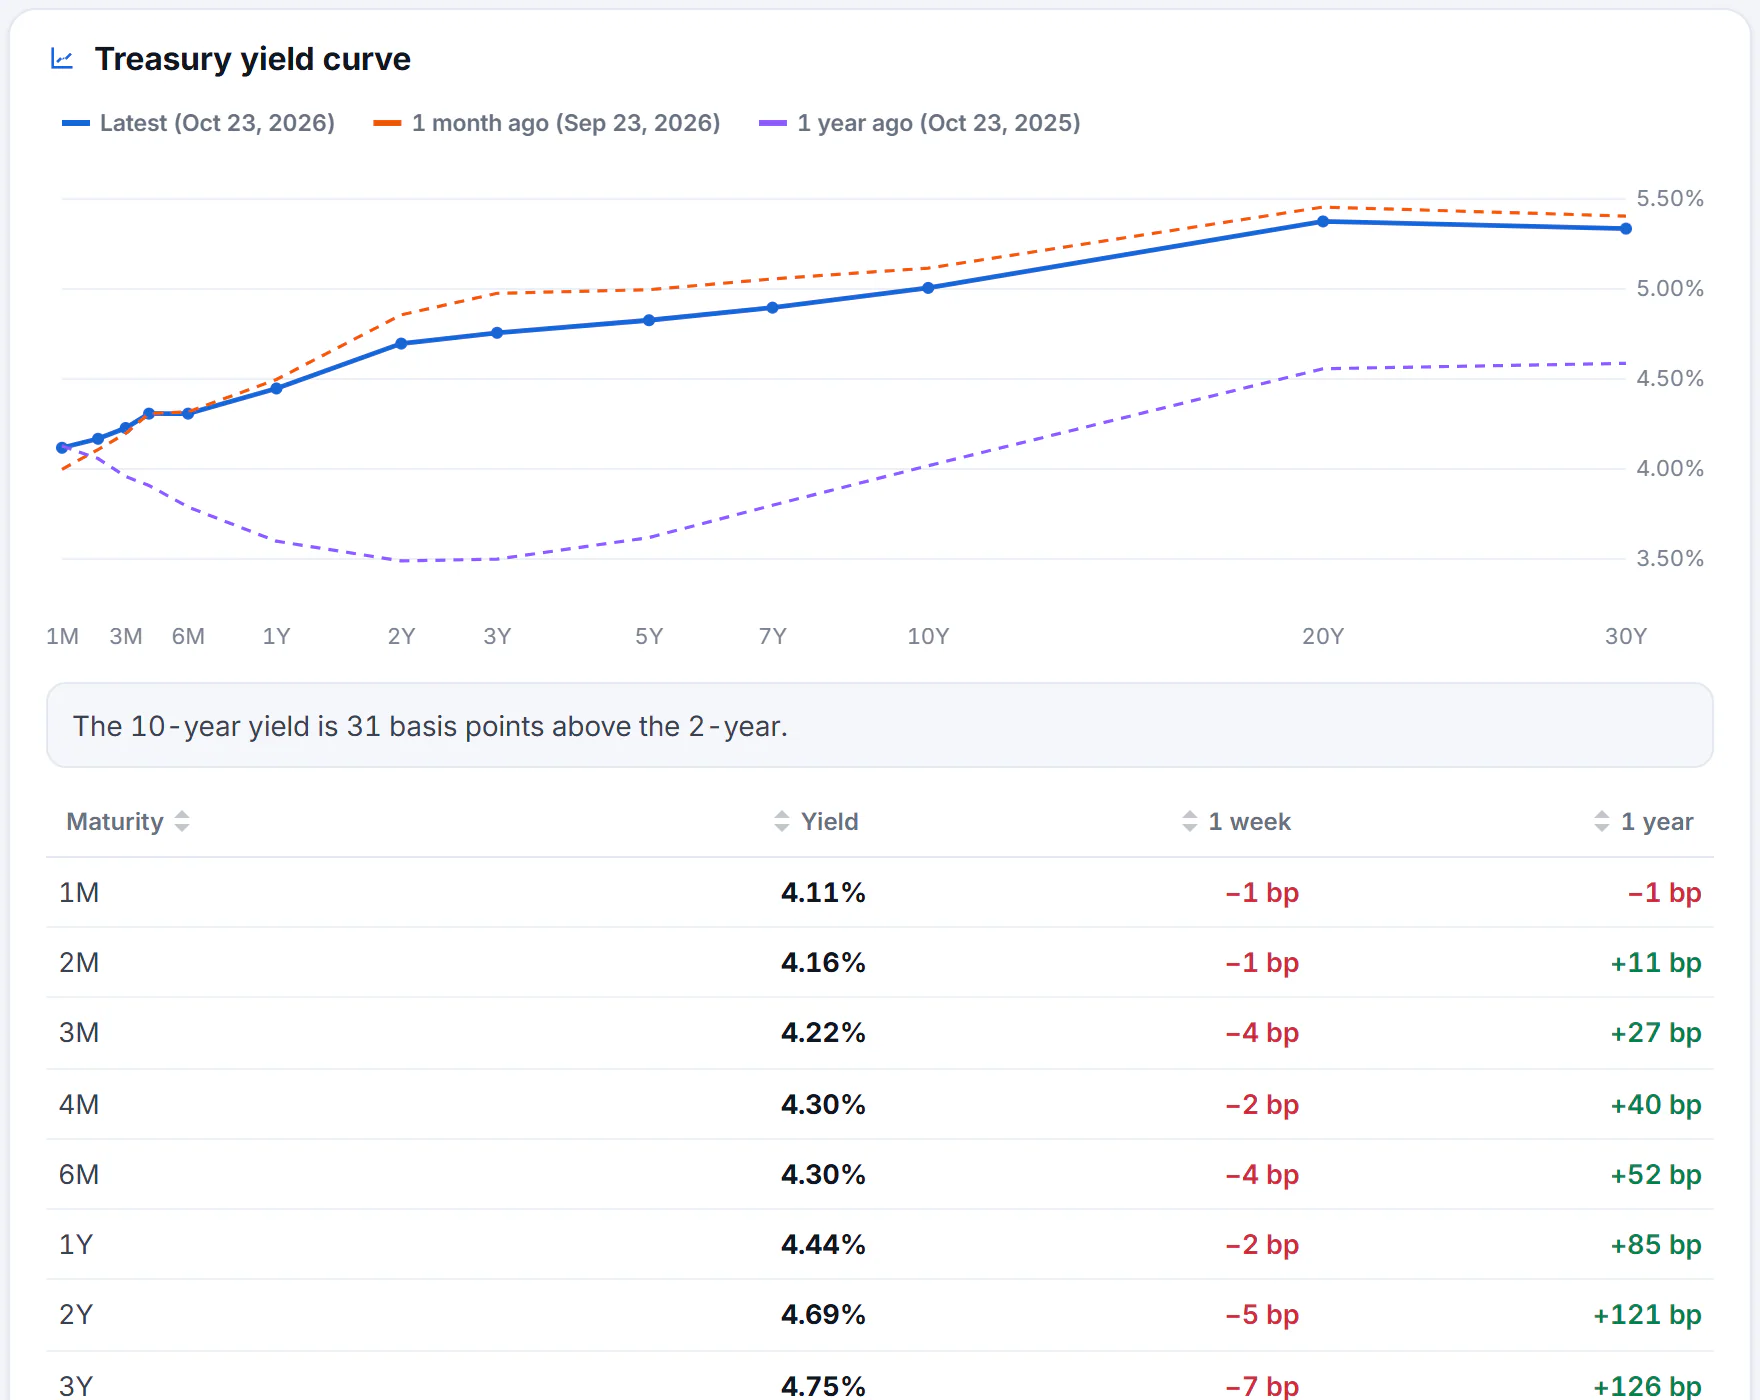
The Treasury yield curve: yield on the vertical axis, how long the money is lent on the horizontal axis. The table gives the figures.
- 1Yield by maturity: today, a month ago, a year ago
- 2Whether the curve is inverted
- 3Yield by maturity, and its change in basis points
When the U.S. Treasury borrows, it pays a yield, a yearly interest rate, that depends on how long the lender waits to be repaid. The Treasury yield curve plots that rate for each length, from one month to thirty years.
The chart has three lines: the Latest curve (solid), the curve 1 month ago and the curve 1 year ago (dashed), each labelled with its date. Hover over the chart to read the yields at one length of time.
Usually longer loans pay more, so the curve slopes up. A sentence under the chart says how far apart the 10-year and 2-year yields are, in basis points: one basis point is one hundredth of a percentage point, so 31 basis points is 0.31 points. When the 2-year yield is higher than the 10-year, the curve is called inverted, and the page says so, noting that this pattern has often preceded recessions. An inversion is a historical pattern, not a prediction.
The table lists each Maturity with its Yield and the change over 1 week and 1 year in basis points. Green is a rise and red a fall. The numbers are the Treasury's daily rates, and the date is shown.
#Yields over time
Yields over time charts the 10-year, 2-year and 3-month yields together, so you can see how the curve's ends have moved and when they crossed.
#Market rates
Market rates lists the benchmark yields, such as the 3-month Treasury bill and the 5-, 10- and 30-year yields, with the change today and the range bars. Each opens a page like any other instrument's. See Funds, indexes, coins and currencies. Yields are quoted in percent.
#The federal funds rate
The Federal funds rate card shows the Effective rate, the rate banks charge each other for overnight loans, the FOMC target range the Federal Reserve has set, and the date of the figure, with a chart of the last year or so. The Fed's decisions move this rate, and many other rates follow it.
To see what traders expect the Fed to do at its next meetings, see Prediction-market odds and The U.S. economy.
#Common questions
What is a basis point?
One hundredth of a percentage point. A change from 4.00% to 4.25% is 25 basis points.
Does an inverted curve mean a recession is coming?
It has often come before one in the past, but it is not a forecast, and Finance does not predict anything.
Where do the numbers come from?
The curve is from the U.S. Department of the Treasury, and the Fed funds rate is from the Federal Reserve Bank of New York. The page names them under each card. Market rates are market data, and may be delayed up to 15 minutes.